See Actual Examples of the Whale Trail Indicator!
No matter what futures instrument or stock symbol you are trading, the Whale Trail Indicator simplifies the market and allows you to focus on what really matters: the Whales and their actions.
Much like in the gambling world, Whales in the trading industry control the price and the market. The Whales are typically referred to as the 'Big Money.' They control millions of dollars and can shift the market. At Whale Trail Trading, we understand this crucial point and developed the Whale Trail Indicator specifically to identify and intuitively signal to the trader what actions the Whales are taking. Following the order flow has never been easier!
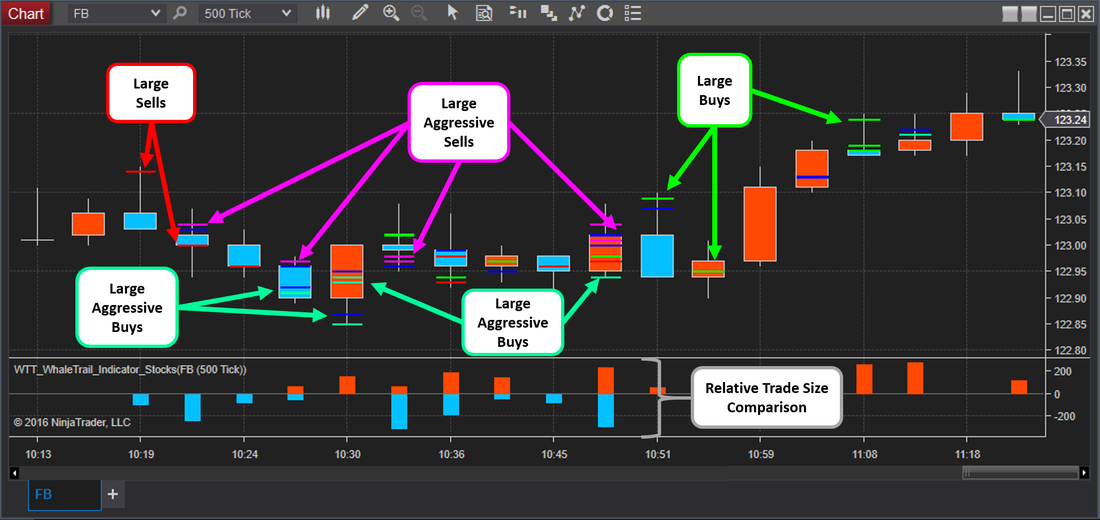
The following is Example 1 of the Whale Trail Indicator in action for Facebook stock with the 'Hide Small Fish' option enabled (this allows you to see only the largest Whales' trades). Notice how easy it is to see when the Whales are in agreement on direction (selling at the left of the chart), when the Whales are fighting for position (middle of the chart), and when the Whales are again in agreement on direction (buying at the right of the chart)!
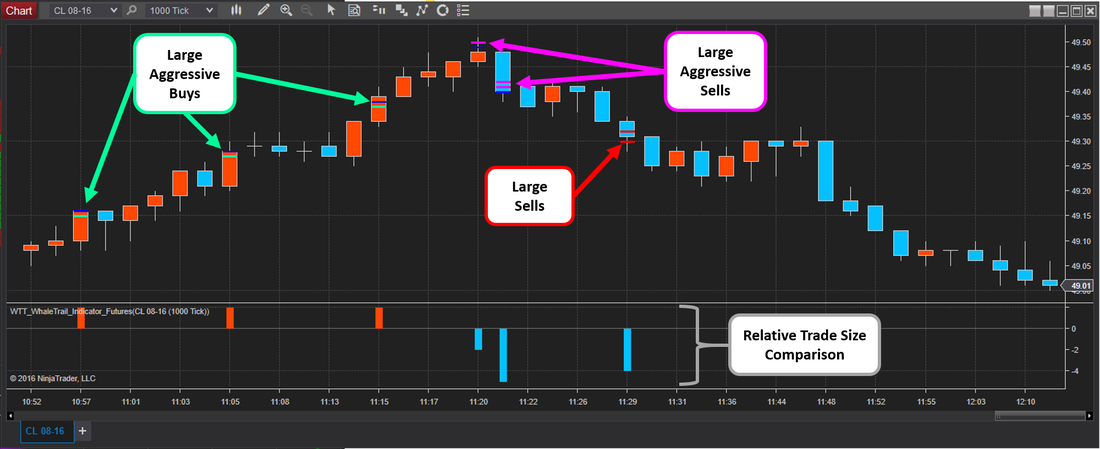
The following is Example 2 of the Whale Trail Indicator in action for the Crude Oil future contract with the 'Hide Small Fish' option enabled (this allows you to see only the largest Whales' trades). Notice how easy it is to see what the Whales are doing and how much time is given to jump in on the action!
Example 3 provides another compelling example of just how powerful the Whale Trail Indicator truly is! At the beginning of the chart (far left), we can see that both the large and small Whales were overwhelmingly bearish and drove the price of Crude Oil down almost 55 cents. Remember: with Crude Oil futures, every $0.01 price change is a $10 profit or loss per contract, so a theoretical trader who was short at $46.70 and exited his position at $46.15 grossed $550 per contract in the 15 minute duration of the trade.
Then, the Whales transitioned to buying (middle of chart): they could have been entering a new long position or exiting a short position. You will notice that some Whales were still selling in the transition period of the chart.
Finally, the Whales started aggressively buying. This drove the price back up quite dramatically (about 35 cents higher in 10 minutes!).
After using the Whale Trail Indicator, traders have a revelation about the market and trading that completely changes not only how they view the market but also how they trade. The highlights from the revelation that our traders have are the following:
Additionally, you will never have to wonder whether you're using the right chart settings. Unlike other indicators, such as the MACD where changing the chart's time consolidation setting changes all of the MACD signals, the Whale Trail Indicator shows the exact same trades on every chart and does not require any adjustments at all by the trader. You will never have to spend another minute deciding if a 1000-tick or 10-minute chart is right for you.
All of these features come packed in a user-friendly chart indicator that uses powerful predictive analytics and complex order flow analysis so that you don't have to worry about any extraneous information and, instead, allows you to do what you enjoy doing: trading!
To experience the power of the Whale Trail Indicator, please sign up for your Free Trial!
- The Whales do not use indicators that retail and many other 'traders' use. The Whales could not care less about whether the MACD line just crossed above the signal line or whether the RSI says that the instrument is oversold; when a Whale wants to sell, it sells. They do not care if the market price just touched the VWAP on the way up; if the Whale wants to buy, it buys.
- Supply and demand move the price. If Whales start supplying an instrument to the market (i.e. selling or offering) but no demand exists at the prices they want, then the price will fall as Whales aggressively start selling. The Whales demanding an instrument will cause an opposite effect.
- When the Whales make several successive, aggressive trades, a wake is left behind. This wake is basically a void left in the offers (if the trades were aggressive sells) or bids (if the trades were aggressive buys). If no other traders come in to fill the void, the price can quickly, and usually temporarily, backtrack until the void is filled. Once the void fills, the price will continue in the direction of the Whales' trades unless the Whales start making countering trades.
- Although the Whale Trail Indicator can be used by itself, if a trader enjoys using other tools or indicators while trading, then the Whale Trail Indicator can act as a powerful confirmation or warning to the trader before pulling the trigger on a particular trade. For example, if the trader's other tools signal to go long but the Whale Trail Indicator shows Whales making many aggressive sells, then the trader should definitely reconsider going long.
Additionally, you will never have to wonder whether you're using the right chart settings. Unlike other indicators, such as the MACD where changing the chart's time consolidation setting changes all of the MACD signals, the Whale Trail Indicator shows the exact same trades on every chart and does not require any adjustments at all by the trader. You will never have to spend another minute deciding if a 1000-tick or 10-minute chart is right for you.
All of these features come packed in a user-friendly chart indicator that uses powerful predictive analytics and complex order flow analysis so that you don't have to worry about any extraneous information and, instead, allows you to do what you enjoy doing: trading!
To experience the power of the Whale Trail Indicator, please sign up for your Free Trial!


